


OpenTelemetry-Native Options for Modern Infrastructure
OpenTelemetry has become the default instrumentation standard for cloud-native observability. CNCF adoption surveys show OTel as the second most active project after Kubernetes, and most new services ship with OTel SDKs or the OTel Collector from day one.
For teams that have committed to OTel, Datadog creates friction. OTel metrics sent to Datadog are often billed as custom metrics – the same data that costs nothing to collect through the OTel Collector becomes a separate, growing line item once it lands in Datadog. The Datadog Agent and the OTel Collector serve overlapping roles, forcing teams to choose between Datadog’s proprietary pipeline and the vendor-neutral standard they adopted. OTLP ingest in Datadog works, but it sits alongside a platform designed around proprietary agents, proprietary query languages, and proprietary integrations.
The result is a structural mismatch: teams invest in open instrumentation for portability and then send that data to a platform whose economics and tooling reward proprietary lock-in.
This guide compares seven Datadog alternatives – CubeAPM, Honeycomb, Grafana Cloud, Elastic APM, Coralogix, Dynatrace, and New Relic – through the lens of OpenTelemetry support, OTel-native architecture, pricing behavior with OTel data, deployment model, and migration feasibility for teams already running OTel Collectors.
Why OTel-First Teams Are Moving Away from Datadog
OTel Metrics Billed as Custom Metrics
When teams send OpenTelemetry metrics to Datadog, those metrics are frequently classified as custom metrics. Beyond included allotments (100 per host on Pro, 200 on Enterprise), custom metrics are billed at $5 per 100/month. For teams with rich OTel instrumentation – Kubernetes labels, service mesh dimensions, application-level counters – this creates a cost penalty for using open standards. The same metrics collected through the Datadog Agent would land in standard infrastructure monitoring; collected through OTel, they become a separate billing category.
Datadog Agent vs OTel Collector: Competing Pipelines
Teams adopting OTel want to standardize on the OTel Collector as their telemetry pipeline. Datadog supports OTLP ingest, but the platform is designed around the Datadog Agent. Many Datadog features – live process monitoring, network performance monitoring, security monitoring – require the Datadog Agent specifically. Running both the OTel Collector and the Datadog Agent adds operational complexity, configuration drift, and resource overhead on every host.
Proprietary Lock-in Behind Open Ingest
Datadog accepts OTLP data, but once telemetry lands in the platform, it is queried through proprietary languages, visualized in proprietary dashboards, and alerted on through proprietary rules. Teams that chose OTel for vendor portability find that the data is easy to send but expensive to move. Dashboards, monitors, SLOs, and alert thresholds are all Datadog-specific – switching backends means rebuilding everything downstream of ingest.
CloudPrem Limitations and Data Residency Gaps
Datadog’s CloudPrem is currently in preview and covers log management only – not a full self-hosted Datadog backend. There is no self-hosted setup for traces. For OTel-first teams in regulated industries, the inability to keep all telemetry signals inside their own infrastructure is a structural blocker, not a feature gap that a roadmap update will fix.
Cost Compounds Across SKUs
Beyond the OTel-specific friction, Datadog’s broader pricing model compounds costs across infrastructure hosts, APM hosts, log ingestion, log indexing, span ingestion, indexed spans, custom metrics, RUM sessions, and synthetic tests. At 30TB/month with 30% log indexing, the total bill can reach $30,000-$45,000+/month. Log indexing alone can account for ~$30,000/month of that total.
How We Evaluated the Best Datadog Alternatives for OTel-First Teams
Every platform in this guide can ingest OTel data. The differences that matter are how natively they support it, how they price it, and whether OTel-first teams hit friction or find a natural fit.
- OTel-native architecture: Is OTel the primary instrumentation path, or is it bolted onto a proprietary agent model? Platforms built on OTel from the start avoid the custom-metrics penalty and pipeline conflicts that OTel-as-addon platforms create.
- OTel data pricing behavior: Does OTel metric data get billed the same as agent-collected metrics, or does it land in a more expensive billing category? This is the single biggest pricing difference for OTel-first teams.
- Collector compatibility: Does the platform work natively with the upstream OTel Collector, or does it require a vendor-specific distribution or sidecar?
- Pricing model and cost predictability: How pricing behaves as telemetry volume grows. We model GB-based, host-based, and feature-based pricing at consistent data volumes.
- Deployment model: SaaS-only, self-hosted, or hybrid. For OTel-first teams in regulated industries, this is often the deciding factor before any other evaluation begins.
- Migration path from Datadog: Teams already running OTel Collectors can reroute data to a new backend without re-instrumenting. We evaluate how much dashboard and alert rebuilding each platform requires.
- The hidden egress cost: When you send telemetry to any external SaaS platform, your cloud provider charges ~$0.10/GB for data leaving your VPC. At 30TB/month, that is $3,000/month, which does not appear on your observability invoice.
1. CubeAPM
Best for: DevOps and platform teams that want full-stack observability inside their own cloud without SaaS data egress, pricing sprawl, or DIY self-hosting overhead

Overview
CubeAPM is a self-hosted, OpenTelemetry-native, full-stack observability platform built for teams that want unified visibility across metrics, events, logs, and traces without the cost sprawl common in SaaS observability tools. It runs inside your own AWS, GCP, or Azure VPC – telemetry data stays inside your infrastructure boundary. CubeAPM monitors the setup remotely, handling upgrades, patches, and platform operations; you provide the infrastructure.
For OTel-first teams, CubeAPM is a natural backend: it was built on OpenTelemetry from the ground up, so OTLP data is the primary ingest path – not a compatibility layer on top of proprietary agents. There is no custom-metrics penalty for OTel data, no competing agent to manage alongside the OTel Collector, and no proprietary instrumentation required.
Ranked in the top 10 APM platforms in G2’s Spring 2026 APM Grid Report and #4 in easiest-to-use APM tools on G2. Used by Policybazaar (insurance), Delhivery ($3.5B logistics), Mamaearth ($1.2B), world’s largest bus aggregator – redBus (part of MakeMyTrip Limited (NASDAQ: MMYT), 8+ countries), Ola, and Practo (healthcare). SOC 2 Type II and ISO 27001 certified. Rated Capterra 5/5 and G2 5/5.
Key Features
- OpenTelemetry-native: Built from the ground up on OTel. Compatible with OpenTelemetry, Datadog, New Relic, Elastic, and Prometheus agents for incremental migration
- Full MELT observability: Metrics, events, logs, and traces in one platform with a single investigation workflow
- Self-hosted, vendor-managed: Deploys in your VPC. Zero cloud egress cost (saves ~$3,000/month at 30TB vs any external SaaS). Your monitoring stays up even if the internet doesn’t.
- AI-based Smart Sampling: Reduces low-value telemetry volume while preserving high-value traces
- Unlimited retention: Included in pricing – no separate retention charges
- MCP server: CubeAPM provides an MCP server that customers can use to query CubeAPM in natural language
- 800+ integrations: Kubernetes, synthetic monitoring, RUM, and error tracking included
Pricing
Ingestion-based, predictable pricing of $0.15/GB. No per-user fees. No per-host charges. No custom metrics fees. Single billing dimension. Unlimited users and unlimited data retention included.
At 30TB/month: ~$5,100/month all-in ($4,500 license + ~$600 infra)
Delhivery: 75% cost reduction after replacing three separate monitoring tools. Mamaearth: ~70% savings, migrated in under an hour. redBus: 4x faster dashboards, 50% faster MTTR.
Pros
- OTel-native from day one – no custom-metrics penalty for OTel data
- 70-75% lower cost than enterprise APM at scale
- Complete data ownership – telemetry never leaves your VPC
- Predictable pricing with no hidden billing dimensions
- Direct engineering support via WhatsApp and Slack – responds in minutes, useful during incidents
Cons
- Requires self-hosted deployment in cloud or on-prem; may not suit teams looking for a SaaS-only model
- AI/ML anomaly detection is growing, but not as mature as Dynatrace Davis AI
2. Honeycomb
Best for: Engineering teams wanting OTel-first observability, high-cardinality debugging, and fast investigation across distributed systems

Overview
Honeycomb was built around OpenTelemetry as its primary instrumentation standard – OTel is not an afterthought or compatibility layer. The platform stores wide events (high-cardinality structured data) and derives trace, log, and metric views from a single unified data model. For OTel-first teams, Honeycomb’s architecture aligns naturally: you send OTLP data and query it without transformation penalties or proprietary agent requirements.
BubbleUp, Honeycomb’s automated outlier detection, surfaces anomalies across telemetry dimensions without predefined queries – useful for debugging novel issues in distributed systems. Service maps and SLOs are built in. A private cloud option was announced in November 2025 for teams with stricter data residency needs, though it is still early.
Key Features
- OTel-first architecture: OpenTelemetry is the primary instrumentation path, not a bolt-on
- Wide events model: Stores high-cardinality structured events; derives traces, logs, and metrics from a single data model
- BubbleUp: Automated outlier detection across telemetry dimensions
- Logs with trace context, metrics support (gauges, sums, histograms)
- Service maps and SLOs included
- Private cloud option announced November 2025
Pricing
Event-volume-based pricing. Free tier: 20M events/month. Pro: from $130/month, up to 1.5B events/month. Enterprise: custom.
At 30TB/month: ~$5,600/month
Pros
- OTel-native – no proprietary agent or custom-metrics penalty
- High-cardinality debugging without pre-aggregation
- BubbleUp surfaces unknown-unknowns without predefined queries
- Competitive pricing at scale for OTel-first teams
Cons
- Less infrastructure-first than traditional APM platforms – teams wanting deep host/network monitoring may need a complementary tool
- SaaS-only for most deployments (private cloud option is still early)
- Dashboard-first teams accustomed to Grafana-style visualization may find the workflow different
- Cost still scales with event volume at high cardinality
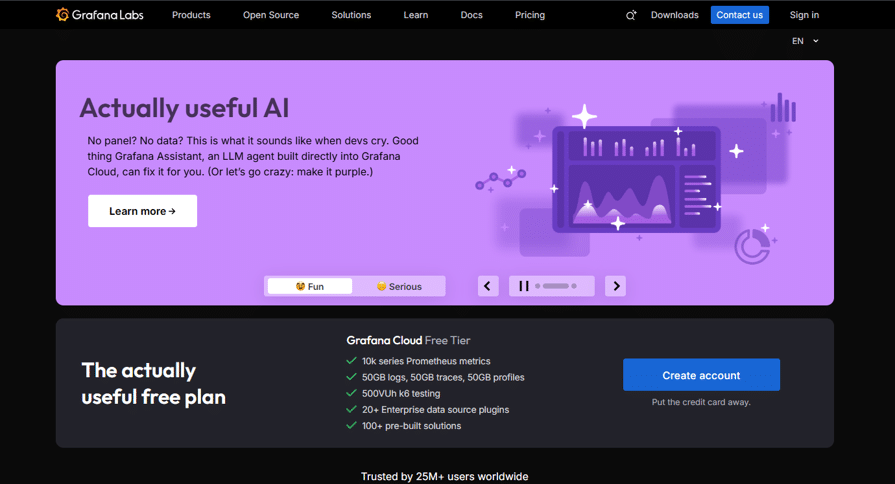
3. Grafana Cloud (LGTM Stack)
Best for: OTel-first teams that want flexible dashboards and open-source foundations

Overview
Grafana Labs assembled the LGTM stack – Loki (logs), Grafana (dashboards), Tempo (traces), Mimir (metrics) – into a coherent observability platform. Grafana Cloud is the managed version. Paired with Grafana Alloy (an OTel Collector distribution), it provides dedicated OTLP endpoints that auto-route signals to the right backend. For OTel-first teams, Grafana offers full OTel-native ingest without the custom-metrics penalty that Datadog imposes – a key advantage when your instrumentation is already OTel-based.
Key Features
- LGTM stack: Mimir for metrics, Loki for logs, Tempo for traces
- Grafana Alloy: OTel Collector distribution with built-in Prometheus pipelines
- Strongest dashboarding and visualization across multiple telemetry sources
- k6 performance testing integrated into the observability ecosystem
- Cost attribution features for metrics, logs, and traces
Pricing
Usage-based across telemetry types. Logs/traces/profiles: $0.50/GB ingested (Pro), 50GB included per signal. Metrics: $6.50/1k active series, 10K included. K8s: $0.015/host hour. Platform fee: $19/month.
At 30TB/month (managed cloud): ~$15,000-$20,000+/month
Breakdown: 20TB logs ~$11,000 + 7TB traces ~$3,500 + 500K metric series ~$4,000 + base. Adaptive Metrics/Logs features can reduce this materially.
Pros
- Fully OTel-native – no custom metrics penalty (unlike Datadog’s OTel-as-custom-metrics billing)
- Adaptive Metrics/Logs actively help reduce billing
- Strong open-source community; highly customizable
- Self-hosted path available for cost-driven teams with operational capacity
Cons
- No native APM out-of-the-box – requires significant configuration
- At scale, self-hosted Grafana is prone to performance degradation; query times increase and dashboard load slows as data volume and user count grow
- Usage-based pricing still grows with volume on managed cloud
- LGTM stack has a steep learning curve for teams new to Grafana
4. Elastic APM
Best for: Teams already on the Elastic Stack who want to add APM and OTel-based observability without a new vendor

Overview
Elastic APM is the distributed tracing and application monitoring component of the Elastic Stack. For teams already indexing logs in Elasticsearch and visualizing in Kibana, adding APM is natural. It supports OpenTelemetry across serverless, self-managed, and hybrid deployments – OTel data lands in the same Elasticsearch indices as agent-collected data, which makes it straightforward for teams transitioning from Elastic APM agents to OTel SDKs.
Note: Elastic APM’s OSS version reached end-of-service in September 2025. The SSPL-licensed version remains available for self-hosted deployments.
Key Features
- Native Elasticsearch integration: APM data correlates directly with log indices
- OpenTelemetry support across serverless, self-managed, and hybrid deployments
- Machine learning-based anomaly detection via Elastic ML
- RUM via JavaScript agent for frontend experience monitoring
- Available self-hosted (SSPL license) or Elastic Cloud (Serverless/Hosted)
Pricing
Self-hosted is free; you cover infrastructure. Elastic Cloud Serverless: Logs Essentials from $0.07/GB ingested + $0.017/GB retained/month. Cloud Hosted from $99/month (Standard) to $184/month (Enterprise).
At 30TB/month (Elastic Cloud): ~$8,000-$15,000/month
Pros
- Zero incremental cost if already running Elastic for logs
- OTel data lands in the same indices as agent data – clean transition path
- Strong log + trace correlation in the same query interface
- Self-hosted option keeps data on your infrastructure
Cons
- Significant operational overhead to run self-hosted at scale – teams wanting self-hosted without the ops burden may prefer vendor-managed alternatives
- KQL (Kibana Query Language) is less developer-friendly than SQL
- 2021 SSPL licensing change – review for open-source compliance
- Pricing varies by deployment model, making cost comparison less straightforward
5. Coralogix
Best for: Teams that want cost-controlled observability with customer-owned data storage and OTel-native pipelines

Overview
Coralogix takes a different approach to observability economics: its Streama engine processes telemetry in-stream before storage, allowing teams to monitor up to 4x more data at lower cost by analyzing data in flight rather than indexing everything first. For OTel-first teams, Coralogix provides native OTel support with 300+ integrations. The DataPrime query engine unifies logs, metrics, and traces querying across all signal types.
A key differentiator is the bring-your-own-storage model: telemetry data lives in the customer’s S3 bucket with infinite retention. Teams get SaaS convenience for querying and alerting while keeping data ownership and compliance control – a middle ground between full SaaS and full self-hosted.
Key Features
- Streama engine: In-stream processing monitors 4x more data at lower cost
- DataPrime query engine: Unified querying across logs, metrics, and traces
- 300+ integrations with native OTel support
- APM, RUM, log analytics, infrastructure, SIEM, AI observability
- Synthetic monitoring included
- Bring your own storage: Data in customer’s S3 bucket with infinite retention
Pricing
Per-signal pricing: Logs $0.42/GB, Traces $0.16/GB, Metrics $0.05/GB (1 GB = 1,000 time series). Unlimited users, hosts, and data sources included.
At 30TB/month: ~$6,370/month
SOC 2 Type II, ISO 27001, GDPR, HIPAA, PCI DSS certified.
Pros
- In-stream processing reduces storage costs while maintaining monitoring coverage
- Customer-owned storage (S3) provides data sovereignty without self-hosting the platform
- Native OTel support with no custom-metrics penalty
- Strong compliance story (SOC 2, ISO 27001, GDPR, HIPAA, PCI DSS)
Cons
- DataPrime is proprietary – not PromQL or SQL, which adds a learning curve
- Signal-based pricing requires careful modeling to forecast costs accurately
- SaaS control plane with customer-owned storage is not the same as fully self-hosted
- Smaller integration ecosystem (300+) compared to Datadog’s 1,000+
6. Dynatrace
Best for: Large enterprises that need AI-automated root cause analysis

Overview
Dynatrace differentiates with its Davis AI engine, which automatically maps service dependencies and performs causal root-cause analysis. Gartner ranks Dynatrace highest in “Ability to Execute” among observability vendors. The platform supports OpenTelemetry via OTLP endpoints, the OTel Collector, and Dynatrace Collector – though it is primarily designed around its proprietary OneAgent. For OTel-first teams, the main question is whether Davis AI’s automation justifies the lock-in to OneAgent and memory-GiB-hour billing.
Key Features
- Davis AI: Automatic baselining, anomaly detection, and causal root-cause analysis
- Full-stack monitoring via OneAgent with automatic service discovery
- OpenTelemetry support via OTLP endpoints, OTel Collector, and Dynatrace Collector
- Dedicated Kubernetes observability with flexible deployment via Dynatrace Operator
- Log management with separate ingest, processing, and retention pricing
Pricing
Usage-based with separate rate-card units. Full-Stack Monitoring at $0.01/memory-GiB-hour (~$58/month per 8 GiB host). Log Management ingest/process at $0.20/GiB, retain at $0.0007/GiB-day.
At 30TB/month: ~$20,000-$35,000+/month
Breakdown: 100 hosts x $0.08/hr x 8 GiB x 730 hrs ~$4,700 + log ingest 20TB x $0.20/GiB ~$4,100 + log retention ~$430 + traces/metrics/APM + commitment overhead.
Pros
- Best automated root cause analysis in the market
- Automatic full-topology discovery – minimal manual configuration
- Managed deployment option for data residency (Dynatrace Managed)
- Strong compliance and enterprise security features
Cons
- Proprietary OneAgent creates its own vendor lock-in – the opposite of what OTel-first teams are trying to achieve
- Memory-GiB-hour pricing is harder to estimate than per-GB models – teams looking for simpler billing may prefer ingestion-based alternatives
- Log retention billed separately from log ingestion
- Davis AI requires a baselining period – new deployments do not get full value immediately
7. New Relic
Best for: Teams that want a mature SaaS observability platform with broad full-stack coverage and native OTLP ingest

Overview
New Relic is a full-stack SaaS observability platform covering APM, infrastructure, browser, mobile, synthetics, logs, Kubernetes, and incident workflows. It supports OTLP ingest and recommends OTLP as the preferred method for sending OpenTelemetry data into the platform. Unlike Datadog, New Relic does not bill OTel metrics as custom metrics – OTLP data lands in the same billing category as agent-collected data, which removes one of the biggest pricing traps for OTel-first teams.
Key Features
- Full-stack observability: APM, infrastructure, browser, mobile, synthetics, logs, Kubernetes, incident workflows
- OTLP ingest – recommends OTLP as preferred method for OpenTelemetry data
- 780+ quickstarts and integrations
- AI-powered: New Relic AI, alert-coverage analysis, automated instrumentation suggestions
- Free tier: 100GB/month + 1 full platform user
Pricing
Data + User model: $0.40/GB ingested (or $0.60/GB for Data Plus with 90-day retention). Full platform users at $99 to $349 per user per month for full platform access. Core Compute model (preview) replaces seats with Compute Capacity Units.
At 30TB/month: ~$20,000-$25,000+/month
Pros
- No custom-metrics penalty for OTel data – OTLP and agent data billed the same
- Broad full-stack coverage in one SaaS platform
- OTLP ingest for OpenTelemetry data
- Free tier offering 100GB free per month is useful for small teams
Cons
- Per-user fees compound quickly – a 20-person team pays $6,980+/month in seat fees alone before data ingestion
- NRQL (proprietary query language) creates migration lock-in for dashboards and alerts
- SaaS-only architecture – no self-hosted option for teams with strict data residency requirements
- CCU billing model (preview) introduces billing opacity that can spike during incidents
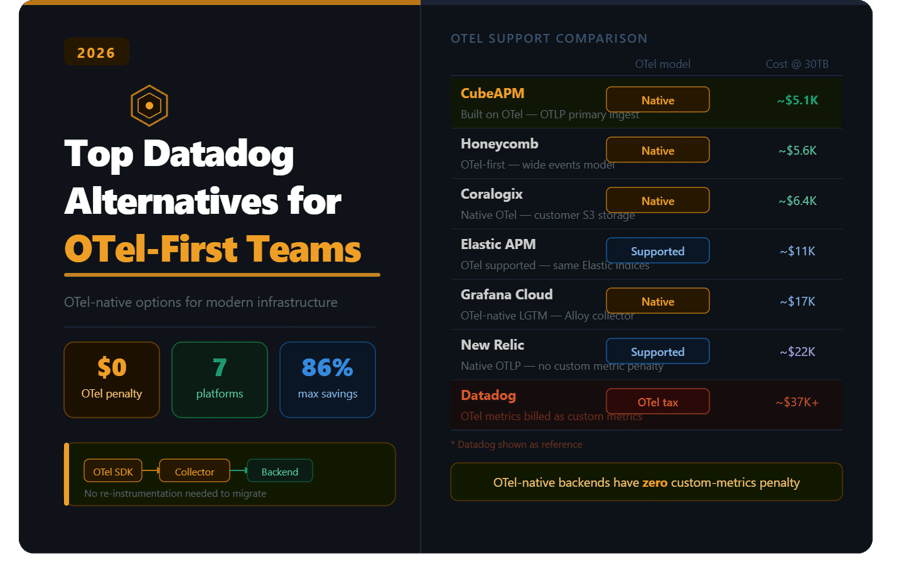
Cost Comparison at 30TB/Month Ingestion
Estimates based on 30TB/month ingestion, 100 hosts, 20 users, 30-day retention. Full methodology at end of article.
| Tool | Est. Cost @ 30TB/mo | Pricing Model | OTel Native | Data Residency | Self-Hosted |
| CubeAPM | ~$5,100/mo all-in | $0.15/GB ingestion-based | Native | Always (in-VPC) | Yes (vendor-managed) |
| Honeycomb | ~$5,600/mo | Event-volume-based | Native | SaaS / private cloud | No (private cloud early) |
| Coralogix | ~$6,370/mo | Per-signal | Supported | Customer S3 bucket | BYOS |
| Elastic APM | ~$8K-$15K | Deployment-based | Supported | If self-hosted | Yes |
| Grafana Cloud | ~$15K-$20K+ | Usage-based | Native | If self-hosted | Yes |
| New Relic | ~$20K-$25K+ | Ingest + per-user | Supported | SaaS only | No |
| Dynatrace | ~$20K-$35K+ | GiB-hour + commit | Supported | Managed option | Managed |
| Datadog (ref.) | ~$30K-$45K+ | Host + feature-based | Supported* | SaaS only | No |
* OTel metrics in Datadog are often billed as custom metrics. Datadog included as reference. Vendor discounts and EDP commitments can significantly reduce SaaS costs.
If you want to model your current Datadog bill before committing to a switch, the Datadog pricing calculator breaks down every cost dimension: hosts, log indexing, custom metrics, APM spans, and cloud egress fees most teams overlook.
The Hidden Cost: Cloud Data-Out Egress
When you send telemetry to any external SaaS platform – Datadog, New Relic, Honeycomb, or any cloud-hosted alternative – your cloud provider charges approximately $0.10/GB for data leaving your VPC. At 30TB/month, that is $3,000/month in AWS or GCP egress fees, which does not appear on your observability invoice. Self-hosted platforms running inside your VPC have zero data-out cost.
How to Migrate OTel-First Teams Away from Datadog
For teams already running OpenTelemetry, the migration path is more straightforward than a full Datadog-to-vendor switch. The OTel Collector is the pivot point – if your telemetry already flows through it, testing a new backend is low-risk.
- Audit your OTel coverage: Identify which services send data through the OTel Collector vs the Datadog Agent. OTel-based telemetry can be rerouted by updating Collector exporter configs – no re-instrumentation needed.
- Identify Datadog-Agent-only dependencies: Features like live process monitoring, network performance monitoring, and security monitoring require the Datadog Agent specifically. Decide which of these are must-haves.
- Map dashboards and monitors: Dashboards, monitors, SLOs, alert thresholds, tags, and notification rules are Datadog-specific and need rebuilding. Prioritize production reliability workflows first.
- Dual-write with the OTel Collector: Configure the OTel Collector to export to both Datadog and the new backend simultaneously. Run in parallel until dashboards and alerts are validated on the new platform.
- Check log indexing and retention: Decide which logs must stay searchable, which can move to cheaper storage, and how long each team needs access. Log indexing is often the biggest cost line to optimize.
- Test before switching fully: Validate critical dashboards, alerts, log search, trace correlation, Kubernetes views, and incident workflows before turning Datadog off.
Migration is easiest when telemetry already flows through OpenTelemetry. The hardest parts are usually dashboards, monitors, log indexing rules, and team workflows built around Datadog over time.
Which Datadog Alternative Is Right for Your OTel-First Team?
- CubeAPM: Choose if you want an OTel-native backend with ingestion-based, predictable pricing of $0.15/GB, zero egress cost, and complete data sovereignty. Runs in your VPC with vendor-managed operations.
- Honeycomb: Choose if your team prioritizes high-cardinality debugging and wants an OTel-first platform where wide events are the native data model. Best for distributed systems investigation.
- Grafana Cloud: Choose if you are OTel-first, want flexible dashboards, and are comfortable managing or funding the LGTM stack. OTel data lands without custom-metrics penalties.
- Elastic APM: Choose if your team already runs the Elastic Stack and wants to add OTel-based distributed tracing without introducing another vendor.
- Coralogix: Choose if you want OTel-native observability with customer-owned storage (S3) and in-stream processing to reduce costs without losing visibility.
- Dynatrace: Choose if enterprise AI automation and causal root-cause analysis are your primary need. Accept that OneAgent is the primary instrumentation model.
- New Relic: Choose if you want broad SaaS observability with OTLP ingest and no custom-metrics penalty. Model user fees carefully as your team grows. If the free tier offering 100GB free per month is sufficient for your needs.
When Datadog Is Still the Right Choice
Datadog is best for teams that want one mature SaaS platform for observability, security, Kubernetes, APM, logs, RUM, synthetics, and integrations, and where cost is not a constraint.
- Your team uses the Datadog Agent across most services and does not plan to adopt OTel as the primary instrumentation path
- You actively use several Datadog modules; replacing a platform your workflows are already built around creates migration work that may outweigh the savings
- The integration ecosystem matters – Datadog’s 1,000+ integrations are hard to replicate quickly
- Cost is not your main constraint, and vendor maturity, support, and feature breadth take priority
- Your usage fits within a predictable range, and the bill stays manageable across the products you use
Final Thoughts
There is no single best Datadog alternative for every OTel-first team. Datadog works well when you need broad SaaS observability, a large integration ecosystem, and your workflows are already built around the platform.
For teams that have standardized on OpenTelemetry and want backends that treat OTel data as a first-class citizen, the landscape is strong. CubeAPM, Honeycomb, and Grafana offer OTel-native architectures where OTLP data flows without custom-metrics penalties or competing agents. Coralogix and Elastic provide OTel support with deployment flexibility. Dynatrace and New Relic offer broader enterprise platforms with OTel ingest, though both retain proprietary elements.
Before switching, test your top two options with real OTel Collector data. Configure a dual-write export, validate dashboards and alerts on the new platform, and compare the actual bill at your telemetry volume. The numbers at your scale will make the decision clearer than any feature matrix.
Methodology
Methodology: 30TB/month (~20TB logs, 7TB traces, 3TB metrics), 30% log indexing, 500K metric series, core observability only. Based on public rate cards, early 2026. Vendor discounts and EDP commitments can significantly reduce SaaS costs.
Frequently Asked Questions
1. Can I send OpenTelemetry data to Datadog?
Yes. Datadog supports OpenTelemetry data ingestion through the Datadog Agent and OTel Collector. However, OTel metrics are often classified as custom metrics in Datadog, which means they can be billed at $5 per 100/month beyond included allotments. OTel-native platforms ingest the same data without this cost penalty.
2. What is the best OTel-native Datadog alternative?
Platforms built on OpenTelemetry from the start – where OTLP is the primary ingest path – offer the most natural fit for OTel-first teams. The best choice depends on whether your priority is cost (ingestion-based pricing), debugging (high-cardinality events), dashboarding (LGTM stack), or data sovereignty (self-hosted or customer-owned storage).
3. Can I migrate from Datadog without re-instrumenting?
If your services already send data through the OTel Collector, you can test a new backend by adding an exporter config – no code changes or re-instrumentation required. Services still using the Datadog Agent will need to be switched to OTel SDKs or the new platform’s agent.
4. Does Datadog charge more for OTel metrics than agent metrics?
In practice, yes. OTel metrics in Datadog are often billed as custom metrics at $5 per 100/month beyond allotments, while the same data collected through the Datadog Agent may land in standard infrastructure monitoring. This creates a cost asymmetry for OTel-first teams.
5. How do I dual-write telemetry during migration?
Configure your OTel Collector to export to both Datadog and the new backend simultaneously. This lets you validate dashboards, alerts, and trace correlation on the new platform while keeping Datadog running. Cut over when the new platform is validated for production workflows.
6. What is the cheapest Datadog alternative for OTel-first teams?
Platforms with per-GB pricing and no per-host or per-user fees offer the lowest TCO at most team sizes – particularly when cloud egress savings are included in the calculation. Self-hosted options can reduce costs further by eliminating the SaaS margin and egress fees.
Keywords: Datadog alternatives OpenTelemetry, OTel-native APM, best Datadog alternatives 2026, OpenTelemetry backend, replace Datadog OTel, Datadog custom metrics OTel, observability platform OpenTelemetry, self-hosted APM, CubeAPM